NDXUSD
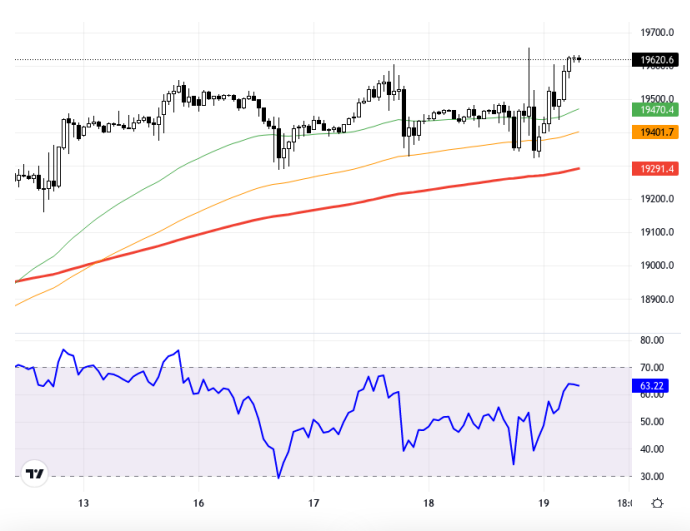
The NASDAQ100 index is following a balanced trajectory due to the Fed's hawkish stance on economic projections and cautious approach to interest rate cuts. While the 50 basis point interest rate reduction has a positive impact on expectations that the economy will stabilize, the presence of factors exerting pressure on the index is noteworthy. Despite the positive mood in Asian indexes and gains in U.S. index futures supporting Nasdaq's desire to rise, uncertainties in the market persist. In the upcoming period, data such as unemployment benefit claims and the Philadelphia Fed manufacturing index are likely to affect the index. In technical analysis, NASDAQ100 maintains stability above the 19600 – 19700 region on the 1-hour chart. Support levels are highlighted at 19291.4 and 19401.7, while resistance levels are at 19620.6 and 19755.1. The RSI indicator is at 63.22, exhibiting a positive outlook, which may indicate the index's upward potential continues. The last recorded price is 19620.6, experiencing a 0.02% decrease compared to the previous day. The index's movements may continue to fluctuate between the defined regions in the short term. Support:19800 - 19700 - 19600 - Resistance:19900 - 20000 -20150 -
NASDAQ100 endeksi, Fed’in ekonomik projeksiyonlarına yönelik şahin tutumu ve faiz indirimleri üzerindeki temkinli duruşuyla dengelenmiş bir seyir izliyor. 50 baz puanlık faiz indirimi, ekonominin düzene gireceği beklentisinde olumlu bir etki yaratırken, endeks üzerinde baskı yaratan faktörlerin de varlığı dikkat çekiyor. Asya endekslerindeki olumlu hava ve ABD endeks vadelilerindeki kazançlar, Nasdaq’ın yükseliş arzusunu desteklemesine rağmen, piyasa genelindeki belirsizlikler devam ediyor. İlerleyen süreçte işsizlik haklarından yararlanma başvuruları ve Philadelphia Fed imalat endeksi gibi verilerin endeks üzerinde etki yaratması muhtemel. Teknik analizde, NASDAQ100 1 saatlik grafikte 19600 – 19700 bölgesi üzerinde kalıcılık gösteriyor. Destek seviyeleri olarak 19291.4 ve 19401.7, direnç seviyeleri olarak ise 19620.6 ve 19755.1 öne çıkıyor. RSI göstergesi 63.22 seviyesinde, pozitif bir görünüm sergiliyor, bu da endeksin yükselme potansiyelinin sürdüğünü işaret edebilir. Son fiyat 19620.6 olarak kaydedilmiştir ve bir önceki güne göre %0.02’lik bir düşüş yaşanmıştır. Endeksin hareketleri, kısa vadede belirlenen bölgeler arasında dalgalanmaya devam edebilir. Destek:19800 - 19700 - 19600 - Direnç:19900 - 20000 - 20150 -