WTIUSD
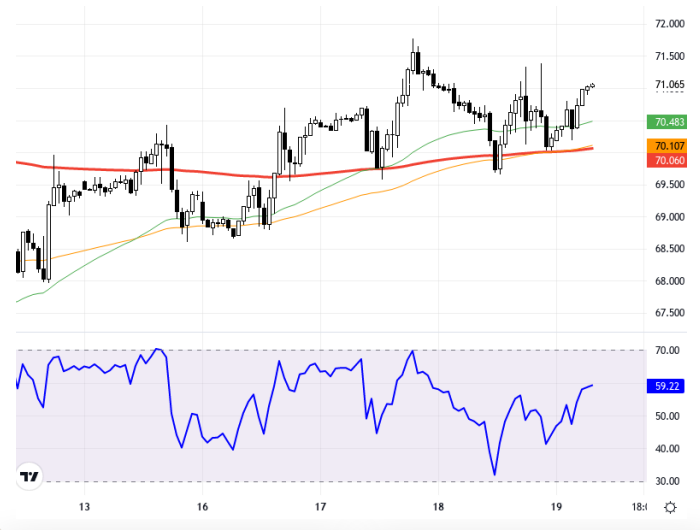
WTI crude oil prices continue to fluctuate with demand uncertainty following the Fed's rate cuts. Developments in European and US markets could be decisive for oil prices. As long as prices remain above the support levels of 68.50 – 69.00, an upward outlook may be possible. However, if these support levels are breached, it is considered that the potential for a decline could increase. From a technical perspective, the WTIUSD chart is on a 1-hour time frame. The 70.00 level stands out as significant support, while 70.50 and 71.00 levels can be monitored as resistance in upward movements. The RSI indicator is at the 59.22 level, showing a slightly positive outlook. With a 0.05% change compared to the previous day, the current price is at the 71.065 level. In light of these data, close monitoring of support and resistance areas may be necessary to determine direction in the short term. Support:69.5 - 69 - 68.5 - Resistance:70.5 - 71 - 71.5
WTI ham petrol fiyatları, Fed’in faiz indirimleri sonrası talep belirsizliği ile dalgalı bir seyir izlemeye devam ediyor. Avrupa ve ABD piyasalarındaki gelişmeler, petrol fiyatları üzerinde belirleyici olabilir. Fiyatlamalar 68,50 – 69,00 destek seviyelerinin üzerinde kaldığı sürece, yukarı yönlü bir görünüm mümkün olabilir. Ancak bu destek seviyelerinin altına inilmesi durumunda, düşüş potansiyelinin artabileceği değerlendiriliyor. Teknik açıdan bakıldığında, WTIUSD grafiği 1 saatlik zaman dilimindedir. 70,00 seviyesi önemli bir destek olarak öne çıkarken, yukarı hareketlerde 70,50 ve 71,00 seviyeleri direnç olarak izlenebilir. RSI göstergesi 59,22 seviyesinde bulunarak hafif pozitif bir görünüm sergiliyor. Önceki güne göre yüzde 0,05’lik bir değişimle güncel fiyat 71,065 seviyesinde. Bu veriler ışığında, kısa vadede yön belirlemek için destek ve direnç bölgelerinin yakın takibi gerekli olabilir. Destek:69.5 - 69 - 68.5 - Direnç:70.5 - 71 - 71.5 -