NGCUSD
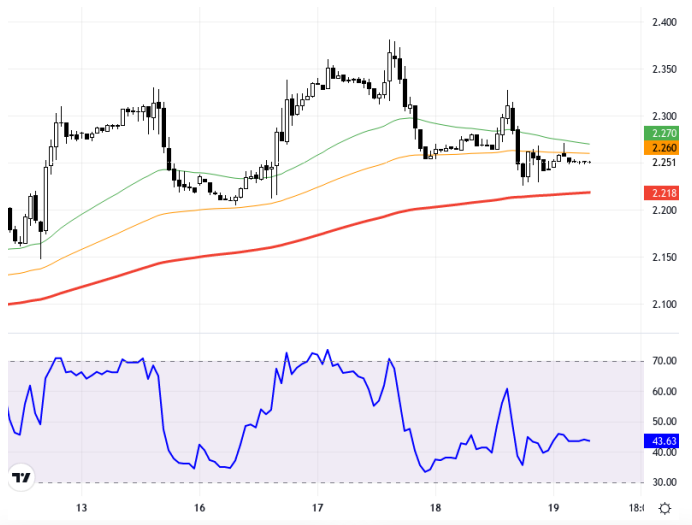
U.S. natural gas futures exhibit a volatile pricing trend dependent on the trends of European and U.S. stock exchanges and the inventory figures provided by the U.S. Energy Information Administration. Natural gas prices fluctuate between the 2.275 – 2.300 region, and a four-hour closure outside this band could provide a clearer outlook on the price direction. For market participants, the key bearish signal is if the levels fall below 2.275 and achieve four-hour closings, in which case the levels of 2.250 and 2.215 may be targeted. On the other hand, recoveries, particularly if the 2.300 resistance is broken, could bring the levels of 2.335 and 2.380 back into focus. From a technical analysis perspective, the hourly chart has been used for the NGCUSD pair. In the pair, the 2.2770 and 2.3000 levels stand out as a shortterm resistance region, while the 2.2500 and 2.2180 levels should be monitored as short-term support. The RSI indicator indicates a neutral outlook at the 43.63 level. A slight decrease of 0.04% compared to the previous day was observed on the chart. The current price is trading at the 2.251 level. In this context, whether the specified critical down and up levels have been broken should be monitored for a clearer result regarding the general direction of the pair. Support:2.275 - 2.25 - 2.215 - Resistance:2.3 - 2.335 - 2.38 -
ABD doğal gaz vadeli işlemleri, Avrupa ve ABD borsalarının seyri ile ABD Enerji Bilgi Dairesi tarafından verilen stok rakamlarına bağlı olarak dalgalı bir fiyatlama eğilimi sergilemekte. Doğal gaz fiyatları, 2,275 – 2,300 bölgesi arasında hareket etmekte ve bu bandın dışındaki 4 saatlik kapanışlar, fiyatın yönü konusunda daha net bir görünüm sağlayabilir. Piyasa katılımcıları için önemli olan düşüş sinyali, 2,275 seviyesinin altında seyirlerin ve 4 saatlik kapanışların gerçekleştirilmesidir, bu durumda 2,250 ve 2,215 seviyeleri hedeflenebilir. Öte yandan toparlanmalar, özellikle 2,300 direncinin kırılması durumunda 2,335 ve 2,380 seviyelerini yeniden gündeme getirebilir. Teknik analiz açısından NGCUSD paritesi için saatlik grafik kullanılmıştır. Paritede 2.2770 ve 2.3000 seviyeleri kısa vadeli direnç bölgesi olarak öne çıkarken, 2.2500 ve 2.2180 seviyeleri kısa vadeli destek olarak izlenmelidir. RSI göstergesi ise 43.63 seviyesinde nötr bir görünümü işaret etmektedir. Grafik üzerinde bir önceki güne göre %0.04 oranında hafif bir gerileme görüldü. Güncel fiyat, 2.251 seviyesinde işlem görmektedir. Bu bağlamda paritenin genel yönü hakkında daha net bir sonuç için belirtilen kritik aşağı ve yukarı seviyelerin kırılıp kırılmadığı takip edilmelidir. Destek:2.275 - 2.25 - 2.215 - Direnç:2.3 - 2.335 - 2.38 -