EURUSD
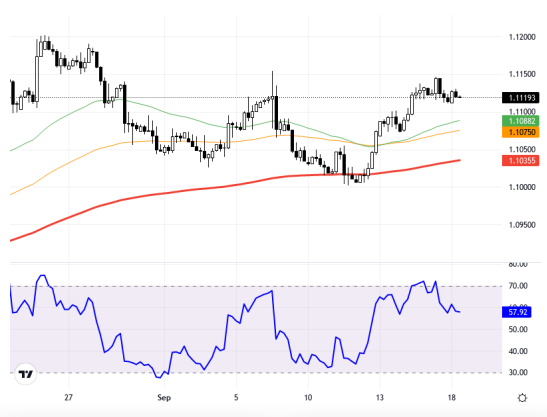
The EUR/USD pair is being closely monitored ahead of today's Federal Reserve meeting in the United States. Investors are facing uncertainty between two options regarding the Fed's interest rate cut: will it be reduced by 25 basis points or 50 basis points? Developments in global markets, as well as the Fed's interest rate policy, along with revisions in economic projections in parameters like inflation, growth, and unemployment, will influence the pair's trajectory. The dollar index is at a decision point at the level of 100.35, indicating uncertainty about the direction of the EUR/USD pair. It is seen in the 4-hour chart that the EUR/USD pair is trying to stay above the 1.1150 level. If it surpasses this level, it could gain positive momentum and rise towards the 1.12 level in upward movements. Support levels are monitored at 1.1082 and 1.1035 levels. The RSI indicator is at 57.87, showing a neutral outlook. There is a 0.01% decrease compared to the previous day, with the current price continuing at 1.1119. In this scenario, whether the resistance level at 1.1150, where investor interest is concentrated, will be broken or not will be important in the short-term flow. Support:1.11 - 1.1085 - 1.034 - Resistance:1.115 - 1.12 - 1.125 -
EUR/USD paritesi, bugün gerçekleşecek olan ABD Merkez Bankası Fed toplantısı öncesinde dikkatle izleniyor. Fed'in faiz indirimine yönelik olarak yatırımcılar iki seçenek arasında bir belirsizlik yaşıyor: 25 baz puan mı, yoksa 50 baz puan mı indirilecek? Küresel piyasalardaki gelişmeler ve Fed'in faiz politikası kadar ekonomik projeksiyonları, enflasyon, büyüme ve işsizlik gibi parametrelerdeki revizyonlar da paritenin seyrinde etkili olacak. Dolar endeksi ise 100,35 seviyesinde karar aşamasında olup bu durum, EUR/USD paritesinin yönüne dair belirsizliğe işaret ediyor. EUR/USD paritesinin 4 saatlik grafikte 1,1150 seviyesinin üzerinde kalmaya çalıştığı görülüyor. Bu seviyeyi aşması durumunda pozitif bir momentum kazanabilir ve yukarı yönlü hareketlerde 1,12 seviyesine doğru çıkış yapabilir. Destek bölgeleri ise 1,1082 ve 1,1035 seviyeleri olarak izleniyor. RSI göstergesi 57,87 seviyesinde ve nötr bir görünüm sergiliyor. Paritede önceki güne göre %0,01'lik bir düşüş söz konusu ve güncel fiyatı 1,1119 olarak devam ediyor. Bu tabloda, yatırımcı ilgisinin yoğunlaştığı 1,1150 direnç seviyesinin kırılıp kırılmaması kısa vadeli akışta önemli olacak. Destek:1.11 - 1.1085 - 1.034 - Direnç:1.115 - 1.12 - 1.125 -