NDXUSD
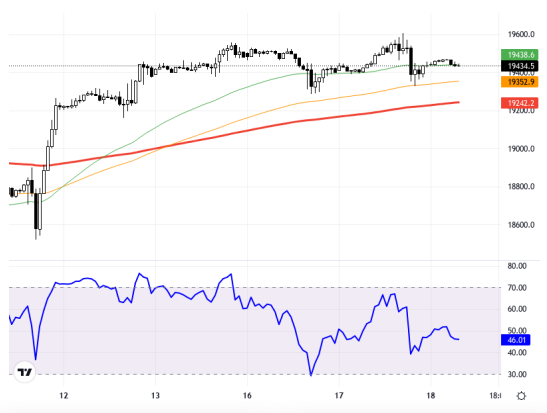
The NASDAQ100 index is trading within a narrow range in anticipation of the Fed’s monetary policy statement. It is believed that the Fed’s decision to cut interest rates could have a significant impact on the markets, as there is no clear consensus among investors on how substantial this cut will be. Discussions about the potential rate cut also bring recession concerns, making the Fed’s messages and future projections critical for the performance of the NASDAQ100. In this context, as long as the index maintains stable pricing above the 19500 – 19600 range, supported by the 21-period exponential moving average, its potential to rise may continue. From a technical analysis perspective, the NASDAQ100 index is trading above the 19340 support level on the hourly chart. In upward movements, the 19500 and 19600 levels can be monitored as resistance. The RSI indicator is at the 46 level, showing a neutral trend, indicating indecision in the market. The index has decreased by 0.9% compared to the previous day. The current price is hovering around 19425, and price movements should be closely monitored from this point. Support:19600 - 19500 - 19155 - Resistance:19700 - 19800 - 19900
NASDAQ100 endeksi, Fed’in para politikası beyanatı beklentileriyle dar bir fiyatlama aralığında işlem görüyor. Fed’in faiz indirimi kararının piyasalar üzerinde büyük etkisi olabileceği düşünülüyor çünkü yatırımcılar arasında bu indirimin ne kadar büyük olacağına dair net bir görüş birliği yok. Potansiyel faiz indirimiyle ilgili tartışmalar resesyon endişelerini de beraberinde getiriyor. Dolayısıyla, Fed’in mesajları ve gelecekteki projeksiyonları NASDAQ100'ün performansı açısından kritik olacaktır. Bu bağlamda, 21 periyotluk üstel hareketli ortalamanın desteklediği 19500 – 19600 bölgesinin üstünde kalıcı fiyatlamalar korunduğu sürece endeksin yükselme potansiyeli devam edebilir. Teknik analiz açısından değerlendirdiğimizde, NASDAQ100 endeksi saatlik grafikte 19340 destek seviyesinin üzerinde işlem görüyor. Yukarı yönlü hareketlerde 19500 ve 19600 seviyeleri direnç olarak izlenebilir. RSI göstergesi 46 seviyesinde, nötr bir eğilim sergiliyor, bu da piyasada kararsızlığa işaret ediyor. Endeksin önceki güne kıyasla %0.9 oranında bir azalış gösterdiği görülüyor. Güncel fiyat 19425 civarında seyrediyor ve bu noktadan hareketle fiyat hareketleri dikkatle izlenmeli. Destek:19600 - 19500 - 19155 - Direnç:19700 - 19800 - 19900 -


