DAXEUR
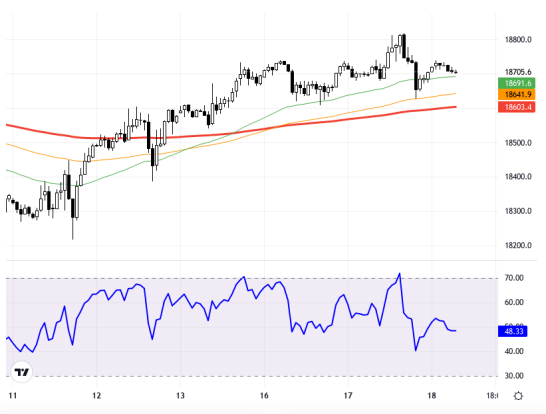
The DAX 40 index is exhibiting a volatile trend due to uncertainties regarding Fed decisions and developments in European markets. Expectations regarding the pace of the Fed's interest rate cuts, in particular, have given the index upward momentum. However, the general state of the European economy and especially signs of economic slowdown in Germany are putting pressure on the DAX. Investors are closely following Federal Reserve Chairman Powell's statements and especially revisions to inflation and growth projections, indicating that current uncertainties may persist in the upcoming period. From a technical analysis perspective, the hourly chart shows the DAX 40 index moving between the levels of 18800 and 18785. These levels should be monitored as an important support zone. In downward movements, the 200- period average at the level of 18603 stands out as a significant support. In upward movements, the level of 19033 could be a critical resistance point, with levels of 19125 and 19200 to be monitored above this threshold. The RSI indicator is at the 48 level, showing a neutral outlook, which indicates that the market is indecisive. It is observed that the index has shown a 0.00% change during the day and is currently at the level of 18705.6. Support:18785 - 18700 - 18620 - Resistance:18910 - 19033 - 19125
DAX 40 endeksi, Fed kararlarına ilişkin belirsizlik ve Avrupa piyasalarında yaşanan gelişmeler nedeniyle volatil bir seyir izliyor. Özellikle Fed'in faiz indirim hızına dair beklentiler, endeksin yukarı yönlü ivme kazanmasını sağladı. Ancak, Avrupa ekonomisinin genel durumu ve özellikle Almanya'daki ekonomik yavaşlama sinyalleri, DAX üzerinde baskı oluşturuyor. Yatırımcıların Fed Başkanı Powell'ın açıklamalarını ve özellikle enflasyon ile büyüme projeksiyonlarına yönelik revizyonları dikkatle takip ediyor olması, mevcut belirsizliklerin önümüzdeki süreçte de devam edebileceğinin bir göstergesi. Teknik analiz açısından incelendiğinde, saatlik zaman diliminde izlenen grafikte DAX 40 endeksi 18800 ve 18785 seviyeleri arasında hareket ediyor. Bu seviyeler önemli destek bölgesi olarak izlenmeli. Aşağı yönlü hareketlerde 18603 seviyesinde bulunan 200 periyodluk ortalama önemli bir destek olarak öne çıkıyor. Yukarı yönlü hareketlerde ise 19033 seviyesi kritik bir direnç noktası olabilir, bu seviyenin üzerinde 19125 ve 19200 seviyeleri izlenebilir. RSI göstergesi 48 seviyesinde olup nötr bir görünüm sergiliyor, bu da piyasanın kararsız olduğuna işaret ediyor. Endeksin gün içinde %0,00'lık bir değişim gösterdiği ve güncel olarak 18705,6 seviyesinde bulunduğu gözlemleniyor. Destek:18785 - 18700 - 18620 - Direnç:18910 - 19033 - 19125 -