NDXUSD
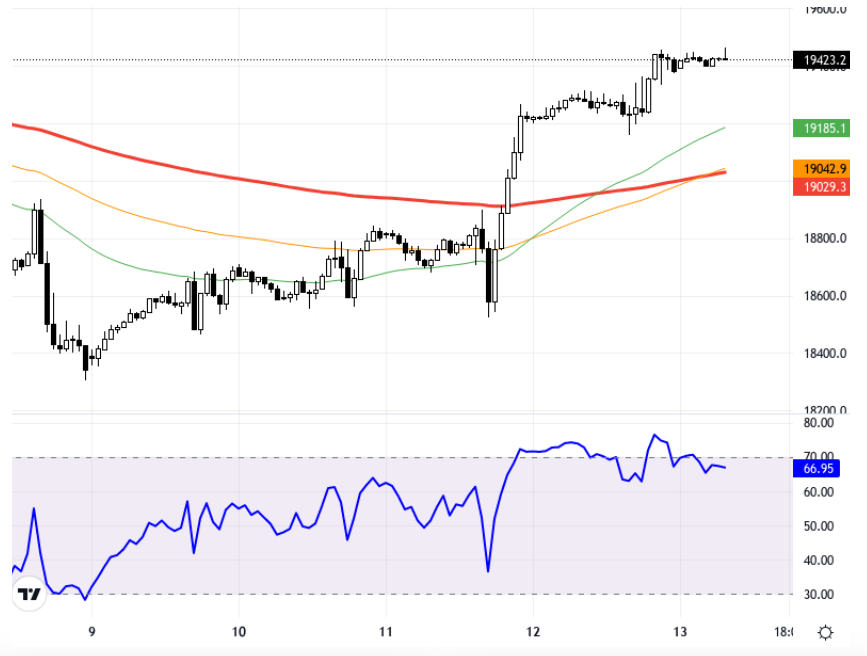
The NASDAQ 100 index finds support despite the U.S. Producer Price Index (PPI) data coming slightly above expectations, due to downward revisions of previous data and the 10-year treasury yield dropping to 3.65%. These developments pave the way for recoveries in the S&P 500 index, with major tech companies like Nvidia, Broadcom, Meta, Amazon, and Alphabet playing a leading role in the index's recovery. Throughout the day, data such as the University of Michigan consumer sentiment and the 12-month inflation expectation could also influence the index's direction. The NASDAQ 100 index is trading above the region supported by the indicated technical indicators, and the general trend is upward. Technically, on the 1-hour chart, the NASDAQ 100 is trading above the 19155 – 19300 support zone. Remaining above these levels could allow prices to move toward the 19500 and 19600 resistance levels. In a downside scenario, if the index falls below this critical support zone, a decline toward the 18975 and 18850 support levels may be observed. The RSI indicator is at 66.87, showing positive momentum. The daily change percentage remains stable around 0.01%. The current price is at the 19428 dollar level. Support:19155 - 18850 - 18750 - Resistance:19400 - 19500 - 19600
NASDAQ 100 endeksi, ABD'deki Üretici Fiyat Endeksi (ÜFE) verilerinin beklentilerin hafif üstünde gelmesine rağmen, önceki verilere yapılan aşağı yönlü revizyonlar ve 10 yıllık hazine getirisinin %3,65'e düşmesiyle destek buluyor. Bu gelişmeler, S&P 500 endeksinde toparlanmaların önünü açarken, endeksin toparlanmasında Nvidia, Broadcom, Meta, Amazon ve Alphabet gibi büyük teknoloji şirketleri öncü rol oynadı. Gün içerisinde Michigan Üniversitesi tüketici hissiyatı ve 12 aylık enflasyon beklentisi gibi veriler de endeksin yönü üzerinde etkili olabilir. NASDAQ 100 endeksi belirtilen teknik göstergelerin desteklediği bölge üzerinde işlem görüyor ve genel eğilim yukarı yönlü. Teknik açıdan, NASDAQ 100 1 saatlik grafikte 19155 – 19300 destek bölgesi üzerinde işlem görüyor. Bu seviyelerin üzerinde kalıcılık, fiyatların 19500 ve 19600 direnç seviyelerine doğru hareket etmesine imkan sağlayabilir. Düşüş senaryosunda, endeksin bu kritik destek bölgesinin altına inmesi durumunda 18975 ve 18850 destek seviyelerine doğru bir gerileme gözlenebilir. RSI göstergesi 66.87 seviyesinde olup pozitif bir ivme sergiliyor. Günlük değişim yüzdesi de %0.01 civarında sabit kalmış durumda. Güncel fiyat ise 19428 dolar seviyesinde bulunuyor. Destek:19155 - 18850 - 18750 - Direnç:19400 - 19500 - 19600