NGCUSD
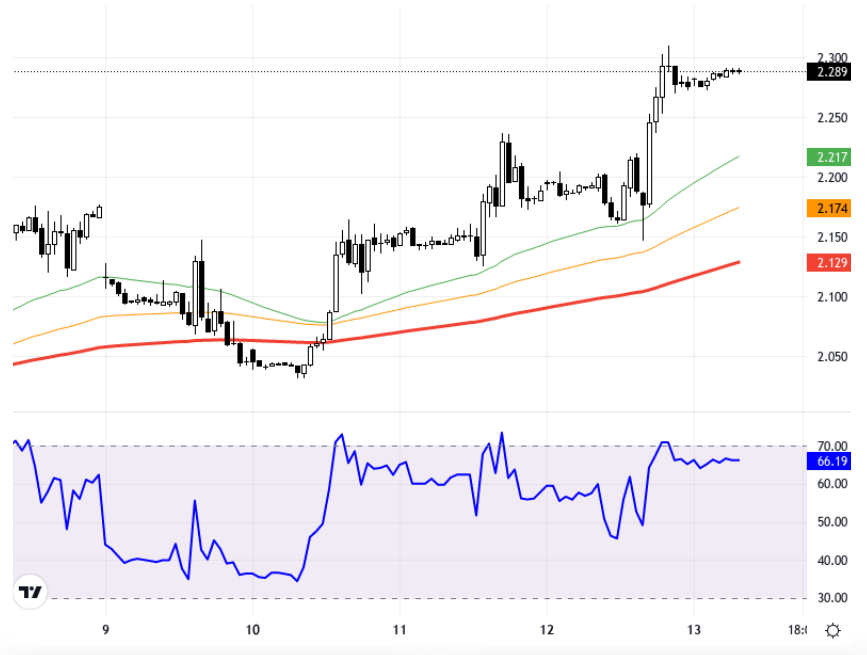
U.S. natural gas futures are attempting to maintain their gains following a lower-than-expected inventory increase announced by the U.S. Energy Information Administration and the threat of a hurricane in the Gulf of Mexico. These developments are affecting market pricing due to their impact on supply constraints and demand expectations. Developments in European and U.S. markets during the day could also influence prices. In the chart, trading is observed on a 1-hour time frame. The 2.290 level is a significant support position for natural gas prices. On the upside, the 2.380 and 2.410 levels can be monitored as resistance. The RSI indicator is at 66, showing a positive outlook. The change compared to the previous day indicates an undecided situation at 0.00%. The current price is trading at the 2.289 level. Support:2.335 - 2.29 - 2.25 - Resistance:2.38 - 2.41 - 2.44 - ABD doğal gaz vadeli işlemleri, ABD Enerji Bilgi Dairesi’nin stoklarda beklenenin altında artış açıklaması sonrasında ve Meksika Körfezi’ndeki kasırga tehdidi nedeniyle kazanımlarını korumaya çalışıyor. Bu gelişmeler, piyasada arz kısıtları ve talep beklentileri üzerindeki etkileri dolayısıyla fiyatlamaları etkiliyor. Gün içinde Avrupa ve ABD borsalarındaki gelişmeler de fiyatlar üzerinde etkili olabilir. Grafikte 1 saatlik zaman diliminde işlem görüldüğü gözüküyor. Doğal gaz fiyatları için 2,290 seviyesi önemli bir destek konumunda bulunuyor. Yukarı yönde sırasıyla 2,380 ve 2,410 seviyeleri direnç olarak izlenebilir. RSI göstergesi 66 seviyesinde ve pozitif bir görünüm sergiliyor. Önceki güne göre değişim ise %0,00 ile kararsız bir durumu işaret ediyor. Güncel fiyat 2,289 seviyesinde işlem görüyor. Destek:2.335 - 2.29 - 2.25 - Direnç:2.38 - 2.41 - 2.44 -