EURUSD
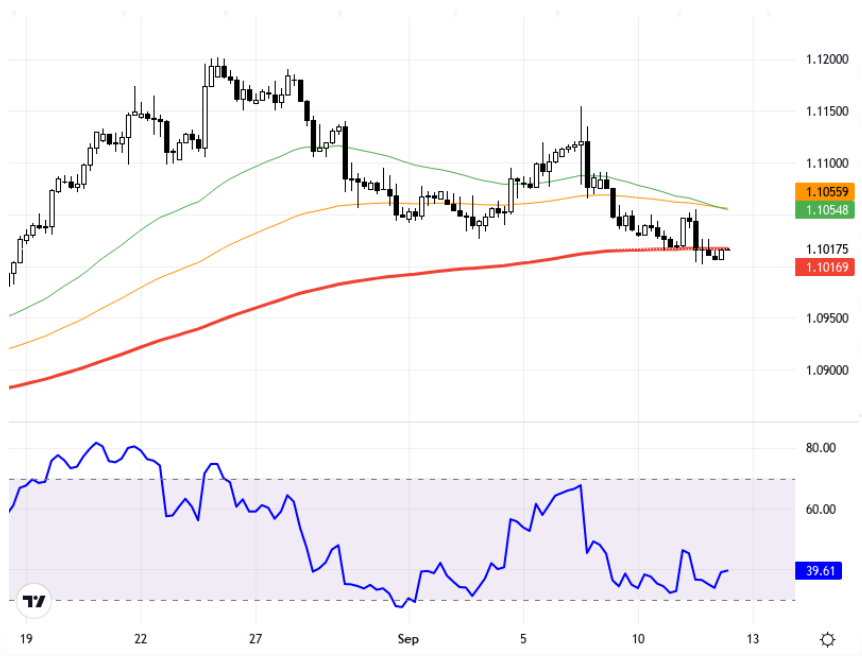
The EUR/USD pair continues to shape in line with the interest rate decision expectations of the US and European Central Banks. In the US, as annual inflation data falls in line with expectations, the high level of Core CPI has increased the expectations for a rate cut by the Fed. The European Central Bank is expected to cut rates by 25 basis points. These developments are critically important in determining the short-term course of the pair. A partial recovery in the Dollar Index poses a pressure factor on the EUR/USD. In technical analysis, it is observed that the EUR/USD pair has dropped below the 55 and 200-period moving averages in the 1.1017 to 1.1057 zone on the 4- hour chart. This indicates a negative outlook for the pair. Testing the 1.1017 support level could signal a continuation of the downward movement. On upward movements, the 1.1055 and 1.1069 levels are monitored as resistance. The RSI indicator is at 39.51, exhibiting a negative outlook. On a daily basis, there is a 0.01% change in the pair, and the current price is at 1.1017. Support:1.099 - 1.094 - 1.09 Resistance:1.1057 - 1.11 - 1.1145
EUR/USD paritesi, ABD ve Avrupa Merkez Bankaları'nın faiz kararı beklentileri doğrultusunda şekillenmeye devam ediyor. ABD'de beklenti doğrultusunda yıllık enflasyon verileri düşerken, Çekirdek TÜFE’nin yüksek kalması nedeniyle bu durum Fed'in faiz indirimine yönelik beklentileri artırdı. Avrupa Merkez Bankası'nın ise 25 baz puanlık faiz indirimi yapması bekleniyor. Bu gelişmeler, paritenin kısa vadeli seyrini belirlemede kritik önem taşıyor. Dolar Endeksi'ndeki kısmi toparlanma ise EUR/USD üzerinde baskı unsuru oluşturuyor. Teknik analizde, EUR/USD paritesinin 4 saatlik grafikte 1.1017 ile 1.1057 bölgesindeki 55 ve 200 periyotluk hareketli ortalamaların altına sarktığı gözlemleniyor. Bu durum, paritede negatif bir görüntünün oluştuğuna işaret ediyor. Paritenin 1.1017 destek seviyesini test etmesi, aşağı yönlü hareketin devam edebileceğinin sinyali olabilir. Yukarı yönlü hareketlerde ise 1.1055 ve 1.1069 seviyeleri direnç olarak takip ediliyor. RSI göstergesi 39.51 seviyesinde olup negatif bir görünüm sergiliyor. Günlük bazda paritede %0.01 değişim görülmekte ve güncel fiyat 1.1017 seviyesindedir. Destek:1.099 - 1.094 - 1.09 - Direnç:1.1057 - 1.11 - 1.1145