NGCUSD
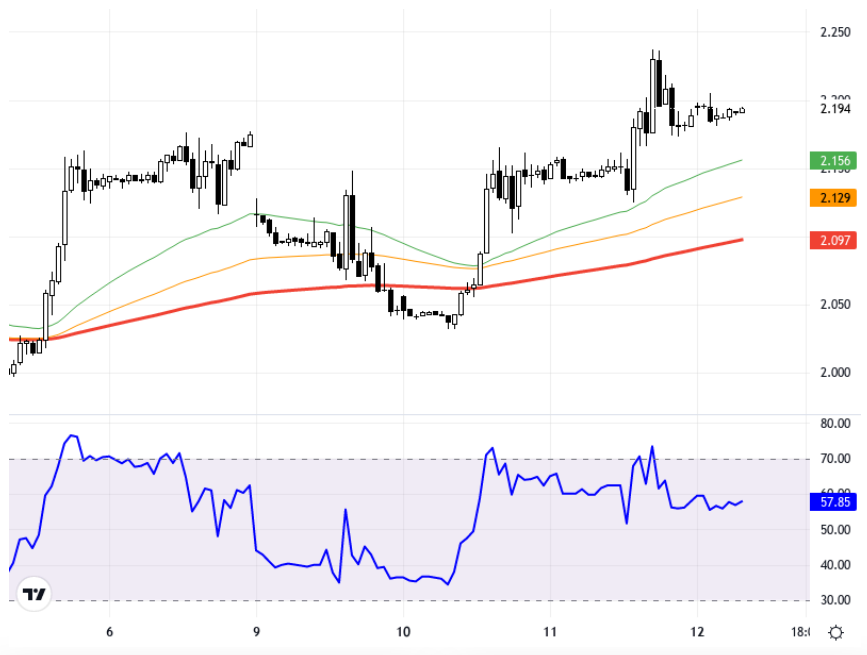
While the US natural gas market is following a sideways trend under the influence of hurricane developments and seasonal demand, the performance of European and US markets will be significant in the coming period. The inventory data released by the US Energy Information Administration could also be decisive in the course of natural gas prices. Staying above the support levels of 2.215 – 2.250 for the natural gas price may support an upward movement. As long as it stays above these levels, 2.290 and 2.335 are seen as potential targets. However, in case of downward pressure, four-hour closings below the 2.215 level could bring the 2.180 and 2.140 levels back into focus. Technically analyzed, the NGCUSD pair is trading on the 1-hour chart. The price is fluctuating around the 2.191 level. In short-term movements, resistance at the 2.156 level and support at the 2.097 level should be monitored. The RSI indicator is at 57.85, displaying a positive outlook. It increased by 0.14% from the previous day with a small rise. The current price is at the 2.194 level, and the market is following an indecisive trend. Support:2.25 - 2.215 - 2.18 - Resistance:2.29 - 2.335 - 2.38 -
ABD doğal gaz piyasası, kasırga gelişmeleri ve mevsimsel talebin etkisi altında yatay bir seyir izlerken, önümüzdeki süreçte Avrupa ve ABD borsalarının performansı önemli olacak. ABD Enerji Bilgi Dairesi’nin açıkladığı stok verileri de doğal gaz fiyatlarının seyrinde belirleyici olabilir. Doğal gaz fiyatının 2,215 – 2,250 destek seviyeleri üzerinde kalması yukarı yönlü hareketi destekleyebilir. Bu seviyeler üzerinde kaldığı sürece, 2,290 ve 2,335 seviyeleri potansiyel hedefler olarak görülüyor. Ancak aşağı yönlü baskıda 2,215 seviyesinin altındaki 4 saatlik kapanışlar, 2,180 ve 2,140 seviyelerinin yeniden gündeme gelmesine neden olabilir. Teknik olarak incelendiğinde, NGCUSD paritesi 1 saatlik grafikte işlem görüyor. Fiyat, 2,191 seviyesinde seyrediyor. Kısa vadeli hareketlerde, 2,156 seviyesinde bulunan bir direnç ve 2,097 seviyesindeki destek alanı izlenmeli. RSI göstergesi 57,85 seviyesinde ve pozitif bir görünüm sergiliyor. Önceki güne göre küçük bir artışla %0,14 değer kazandı. Güncel fiyat 2,194 seviyesinde, piyasa kararsız bir seyir izliyor Destek:2.25 - 2.215 - 2.18 - Direnç:2.29 - 2.335 - 2.38 -