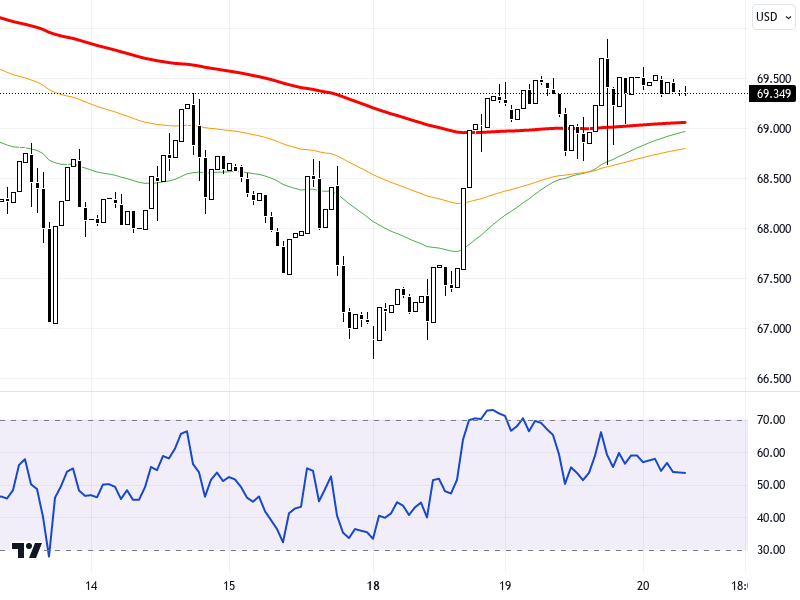
WTIUSD
Despite the rising tensions between Ukraine and Russia, oil prices are trending sideways, influenced by inventory increases reported by the American Petroleum Institute. The trends in European and US markets, along with stock data to be announced by the US Energy Information Administration, will be important in determining the short-term direction of oil. In a period where Asian markets are relatively calm and US 10-year Treasury yields have reached 4.40% with a limited increase, the dollar index is also showing a limited rise. Amid geopolitical risks and increased volatility, oil prices continue to exhibit a relatively calm trend.
On the WTIUSD chart, prices are trading at 69.354. In technical analysis, as long as prices remain above the 68.50 - 69.00 support level, the upward outlook may be more prominent. In possible upward movements, the 69.50 and 70.00 resistance levels can be monitored. In downward movements, trends below 68.50 should be observed, and potential closings below this level could bring the 68.00 and 67.50 levels into focus. On the daily chart, the RSI indicator is at the 50 level and shows a neutral trend. Prices have shown a decline of approximately 0.11% compared to the previous day.
Support :
Resistance :


