DAXEUR
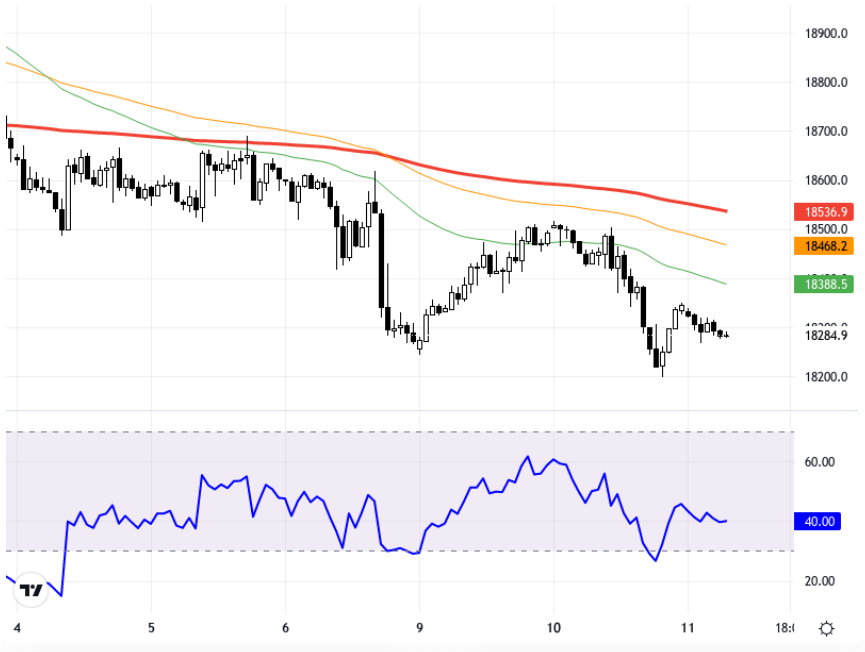
DAX 40 index is trying to find direction this week through global economic headlines. Especially the U.S. presidential candidates' debate, the U.S. inflation data, and the ECB interest rate decision are key economic data points this week. These data could make the expectations regarding the Fed’s interest rate decisions more clear. The interest rate policies of central banks and potential volatility in the markets could increase the pressure on the index. Under the current economic conditions, especially the slowdown signals in the German economy are among the critical factors that investors should watch closely. Technically, when analyzed on the hourly chart, the DAX 40 index is at 18283 and moving below the 18420 - 18560 resistance zones. The index approaching the 18260 support level may target the 18170 and 18080 support levels in downward movements. The RSI indicator is currently at 40, presenting a negative outlook. The index has shown a 0.01% decrease compared to the previous day. For the index to gain momentum, stronger buying signals are needed. The current price is at 18283. Support:18260 - 18170 - 18080 Resistance:18350 - 18420 - 18560
DAX 40 endeksi, bu hafta küresel ekonomik gündem başlıkları ile yön bulmaya çalışıyor. Özellikle ABD'de gerçekleşen başkan adayları tartışması ile başlayan hafta, ABD enflasyon verisi ve ECB faiz kararı gibi önemli ekonomi verileri ile devam ediyor. Bu veriler, Fed’in faiz kararlarına dair beklentileri daha belirgin hale getirebilir. Endeks üzerinde Merkez Bankalarının faiz politikaları ve piyasalarda oluşabilecek volatilite baskıyı artırabilir. Mevcut ekonomik koşullarda, özellikle Alman ekonomisindeki yavaşlama sinyalleri yatırımcılar için dikkatle izlenmesi gereken unsurlar arasında. Teknik açıdan, DAX 40 saatlik grafik perspektifinde değerlendirildiğinde, endeks 18283 seviyelerinde ve 18420 - 18560 direnç bölgeleri altında hareket ediyor. 18260 desteğine yaklaşan endeks, aşağı yönlü hareketlerde 18170 ve 18080 destek seviyelerini hedefleyebilir. RSI göstergesi şu an 40 seviyesinde ve negatif bir görünüm sergiliyor. Bir önceki güne göre %0,01 düşüş gösteren endeksin ivme kazanması için daha güçlü alım sinyalleri gereklidir. Güncel fiyat 18283 seviyesinden işlem görüyor. Destek:18260 - 18170 - 18080 Direnç:18350 - 18420 - 18560