NGCUSD
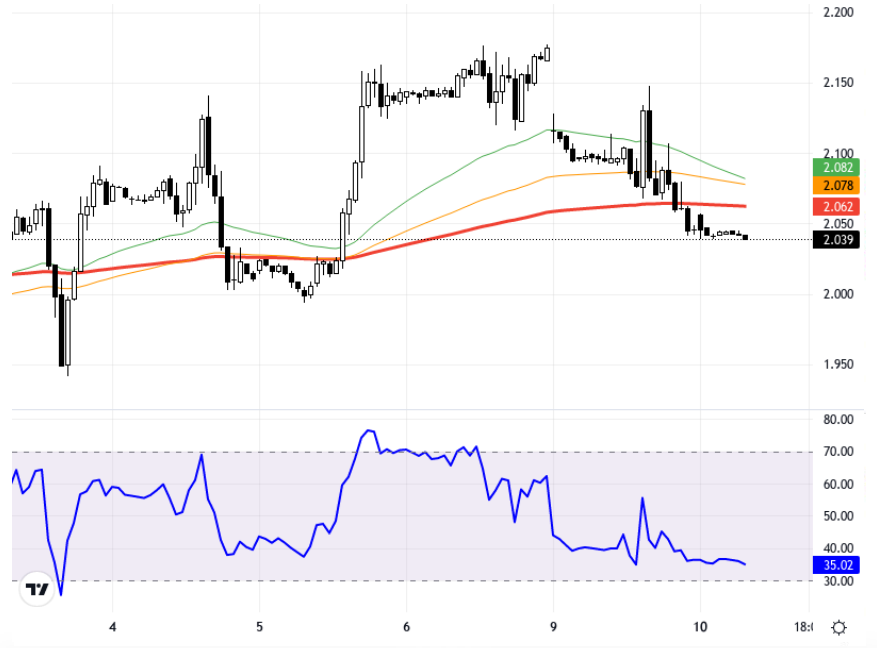
U.S. natural gas futures are showing a downward trend due to the expected hurricane in the Gulf of Mexico. The hurricane could disrupt shipments in the region and reduce demand due to potential power outages. This situation has raised concerns about an oversupply. Throughout the day, movements in European and U.S. stock markets, as well as inventory reports, may impact natural gas prices. Natural gas prices are trading at 2.044 on the 4-hour chart. On the downside, support levels at 2.1, 2.06, and 2.02 are being closely watched, while on the upside, resistance is noted at 2.18 and 2.215. The RSI indicator is at 35, indicating that prices are under downward pressure. Support:2.1 - 2.06 - 2.02 Resistance:2.18 - 2.215 - 2.25
ABD doğal gaz vadeli işlemleri, Meksika Körfezi'nde beklenen kasırga nedeniyle gerileme eğilimi gösteriyor. Kasırga, bölgedeki sevkiyatları aksatabileceği gibi, olası elektrik kesintileri ile birlikte talebi de düşürebilir. Bu durum arz fazlası endişelerini artırmış durumda. Gün içinde Avrupa ve ABD borsalarındaki hareketler ve stok raporları doğal gaz fiyatları üzerinde etkili olabilir. Doğal gaz fiyatları, 4 saatlik grafikte 2.044 seviyesinde işlem görüyor. Aşağıda 2.1, 2.06 ve 2.02 destek seviyeleri dikkatle izlenirken, yukarıda 2.18 ve 2.215 direnç seviyeleri takip ediliyor. RSI göstergesi 35 seviyesinde olup, fiyatların aşağı yönlü baskı altında olduğunu gösteriyor. Destek:2.1 - 2.06 - 2.02 Direnç:2.18 - 2.215 - 2.25