NGCUSD
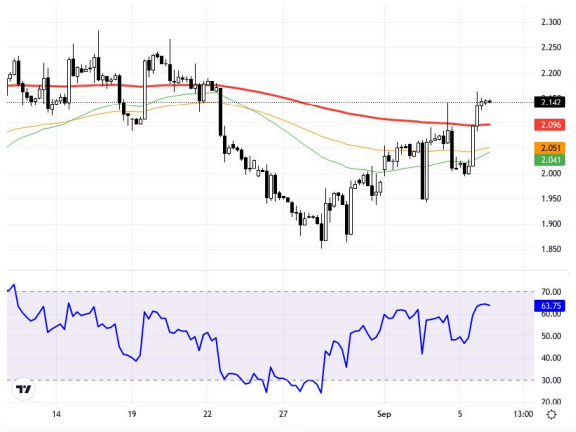
U.S. natural gas futures rose after storage increases fell significantly short of market expectations, testing their highest levels since mid-August. Uncertainties surrounding global energy demand and weather-related fluctuations continue to support prices, while the general trend in European and U.S. stock markets will also influence pricing. On the 4-hour chart, natural gas futures find support at the 2.09 and 2.051 levels, while resistance is seen at 2.18 and 2.215 levels. The RSI indicator stands at 64.32, indicating that it is approaching overbought territory. Natural gas prices are trading flat at 2.145, showing no change from the previous day. Support:2.215 - 2.18 - 2.14 Resistance:2.29 - 2.335 - 2.38